Quick guide to the BIS Stats Explorer Table page
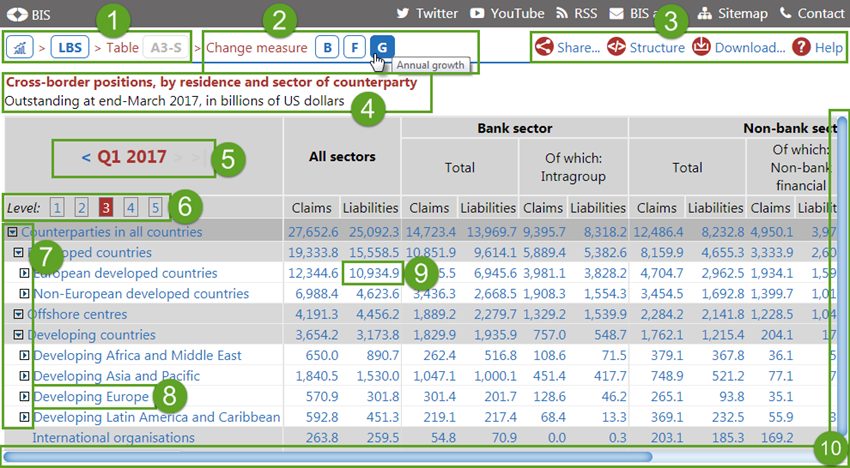
In the BIS Statistics Explorer, a Table page shows one of the published data tables. The key elements are
- Explorer navigation breadcrumb
- Table measure selector
- Table title and subtitle
- Toolbar
- Period navigation control
- Preset row-level expand/collapse
- Individual row-level expand/collapse
- Direct link to country table
- Data value: link to underlying historical time series
- Wide tables scrollbars
-
Table measure selector
Some tables can show data for different measures. These buttons allow to quickly switch between the available ones.
-
Table title and subtitle
Self-explanatory.
-
Toolbar
Four options are available. The "Share..." button will open a menu that allows to share the link to the current page on Twitter, Linkedin, via eMail, or copy it to the Clipboard. The "Structure" link will show a page presenting the coding structure of the current data table. The "Download..." button will open a menu to start a download of the current table as a PDF document or of a CSV file with all the data behind the current data table. The "Help" link opens this page.
-
Period navigation control
Use the "<" and ">" links to change the current period to the previous or the next one. The ">|" link takes to the latest period available.
-
Preset row-level expand/collapse
These numeric links will expand/collapse the table's rows up to the chosen level. See the next point for how to work at a local level.
-
Individual row-level expand/collapse
When clicked, a "right", or "down", arrow will expand/collapse all the following table's rows with a higher level.
-
Direct link to country table
In some summary tables, where data for a number of countries are organised by rows, the country name in the first column is a direct link to a country-specific table, with more detailed data. -
Data value: link to underlying historical time series
All values in the tables are linked to the time series/expressions underlying the table's cell (see also the "Structure" tool). Clicking the link, the corresponding time-series page will open.
Symbols:\ the observation is suppressed for reasons of confidentiality ... the observation is missing 0.0 the observation value is zero or rounds to zero <blank> the series is not reported or the item is not collected -
Wide tables scrollbars
Scrollbars signal the presence of more rows and / or columns. The headers are fixed.