Quick guide to the BIS Stats Explorer
The BIS Statistics Explorer can be used to explore the BIS statistics data sets, starting from navigating the published data tables. In the tables, each number is linked to the underlying historical data (the time series). The data can be graphed, compared and downloaded.The basic steps for using the Explorer are outlined below. More information about the various options can be found in the specific pages: the Table help page and the Time Series help page.
-
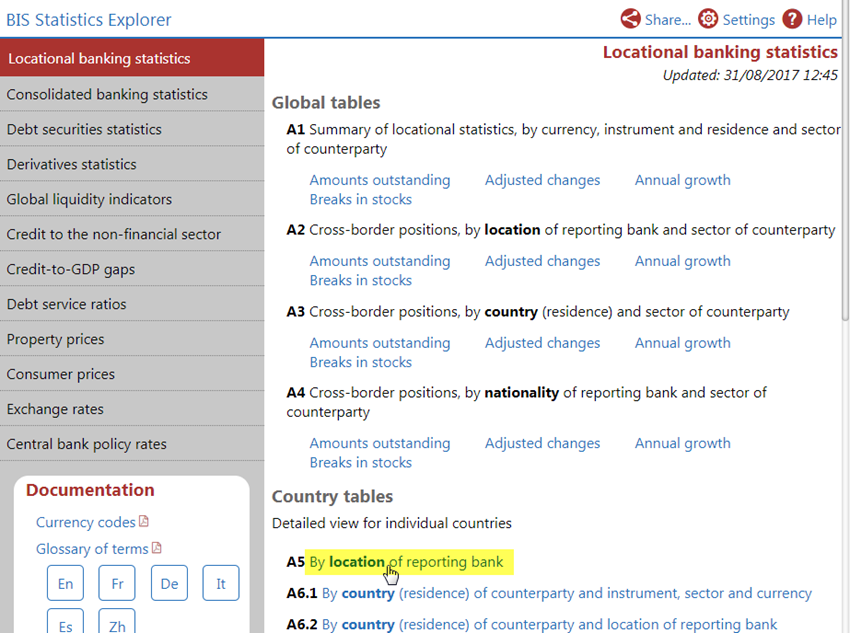
Choose the data set
The BIS publishes data on a number of statistics categories. These are available in the left-hand panel.
-
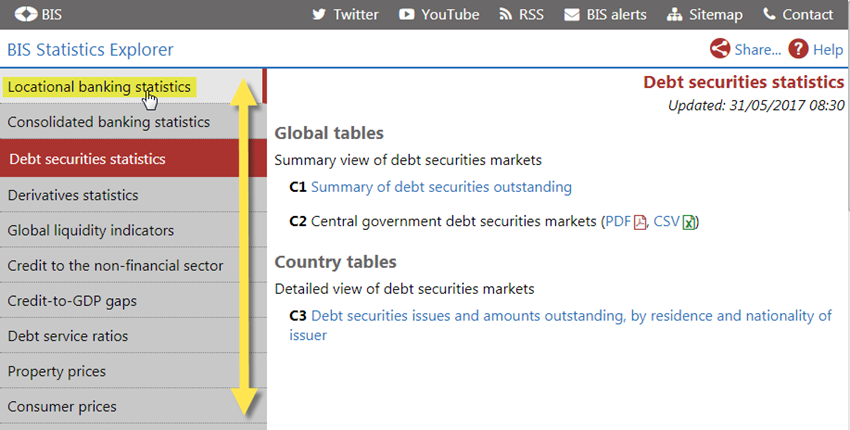
Choose the table
For the selected category, the right-hand panel will show the available tables: click the link in the title.
-
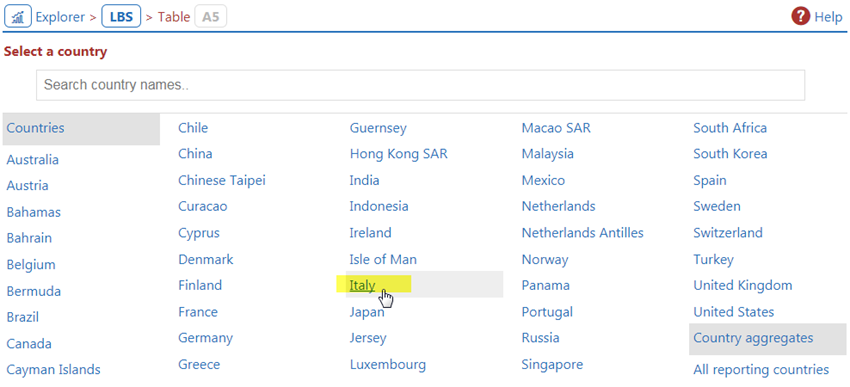
For "country tables", select the desired country
Some tables are designed to show detailed country data. The Explorer will propose a list countries and/or country aggregates.
-
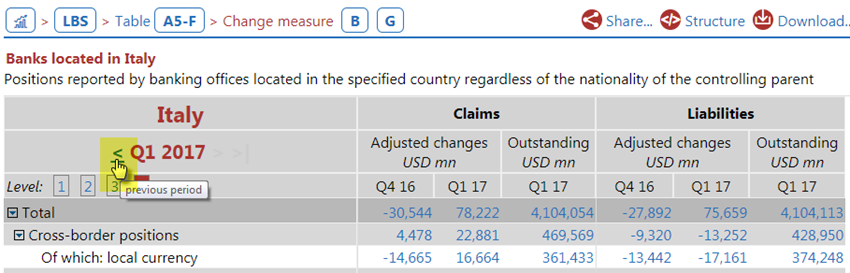
Explore the historical data: change the table's period
The table will generally show data based on the latest available period. Use the links beside the current period label to change the period.
-
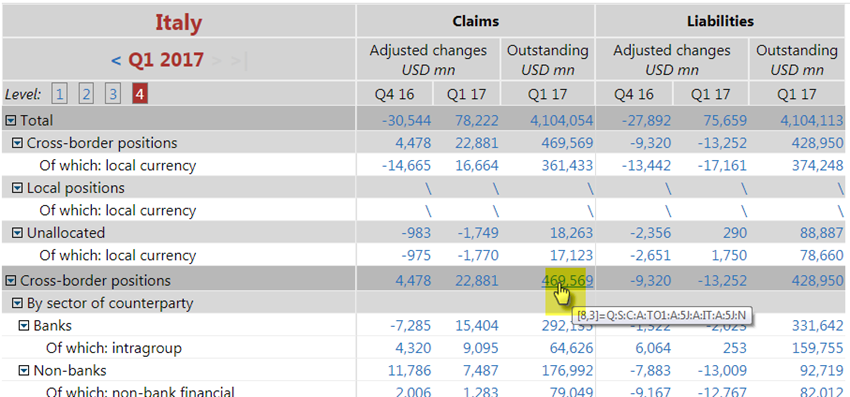
View information and chart the history of a value
All values in the table are linked to the underlying time series. Click the value to get more information about the specific table cell.
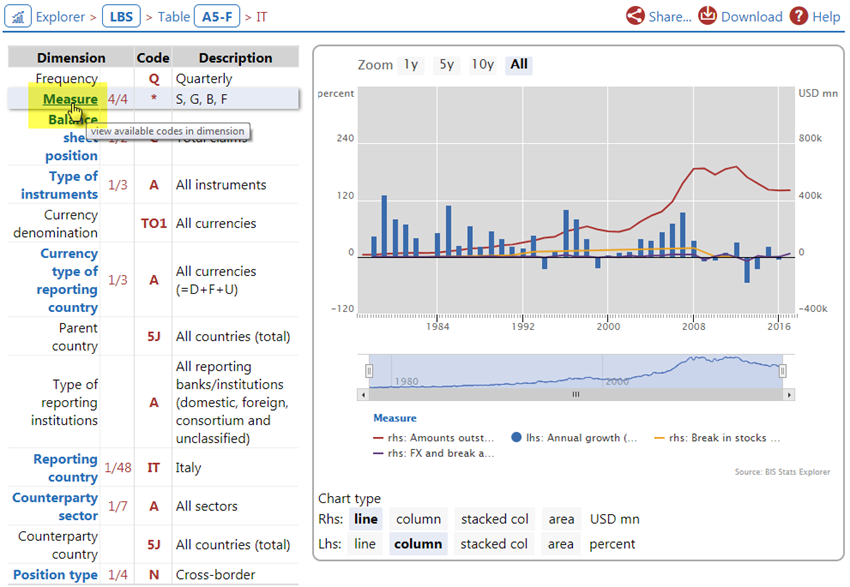
Compare with similar data: select other members in a dimension
Starting form the current time series, the Explorer finds neighbouring series that have similar data but for a different member in one of the coding dimensions.