Quick guide to the BIS Stats Explorer Time Series page
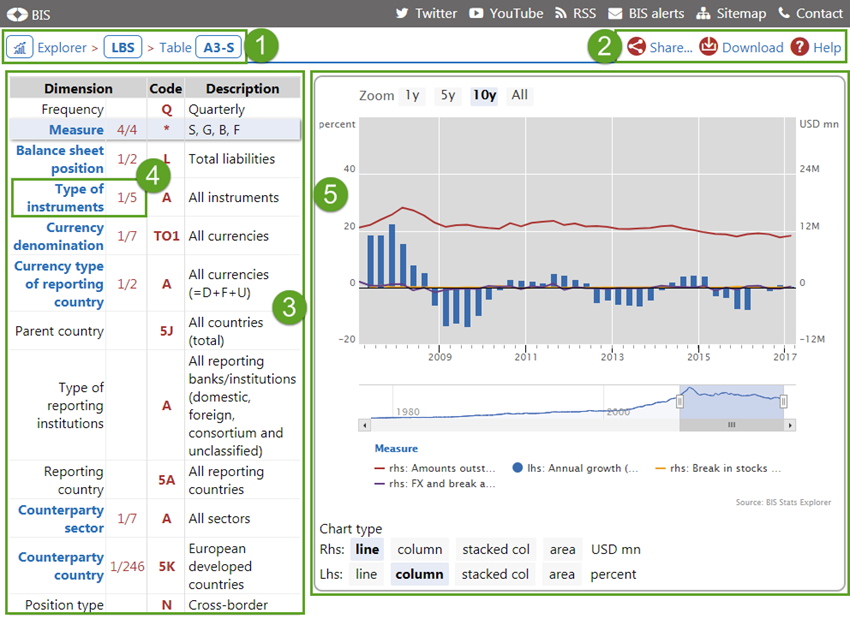
In the BIS Statistics Explorer, the Time Series page shows details for a time series referred in a table. The key elements are
- Explorer navigation breadcrumb
- Toolbar
- Time series code: explain
- Time series data compare
- Graph panel
-
Toolbar
Three options are available. The "Share..." button will open a menu that allows to share the link to the current page on Twitter, Linkedin, via eMail, or copy it to the Clipboard. The "Download" link will start a download in CSV format of the data currently visible in the graph. The "Help" link opens this page.
-
Time series code: explain
The left-hand panel has two main functions. The first is to break down the Time series code key into dimensions and expand the specific member codes with their description. In the data code, the dimension's member codes are separated by the column (":") character. In the data structure of the specific statistics, each code has a description. Read through the descriptions to understand what specific concept is measured in this time series.
The second function of this panel is to show the presence of neighbouring data series. See the following point. -
Time series data: compare
When neighbouring data series are present, the left-hand panel allows you to browse and graph/compare them with the base one. In the Dimension column, the specific dimension name is a link. Next to it, a count shows how many similar series are available. By clicking on the dimension name, a selection filter panel opens with all the available dimension members (defining the neighbouring series codes).

This enables a quick comparison across similar measured concepts. When a code is selected the respective time series is plotted in the graph panel.
-
Graph panel
The selected time series are charted in this panel. The control at the bottom of the graph allows you to zoom in on a specific time interval while the "Zoom" buttons offer predefined intervals. Hovering over the chart, a legend displays the values for the running period. The "Chart type" buttons allow to set the chart type used in the graph.
